Transform your event data into stunning visual insights with trend indicators, performance tracking, and actionable analytics that help you optimize every aspect of your events.
Beautiful visualizations with actionable insights that drive event success
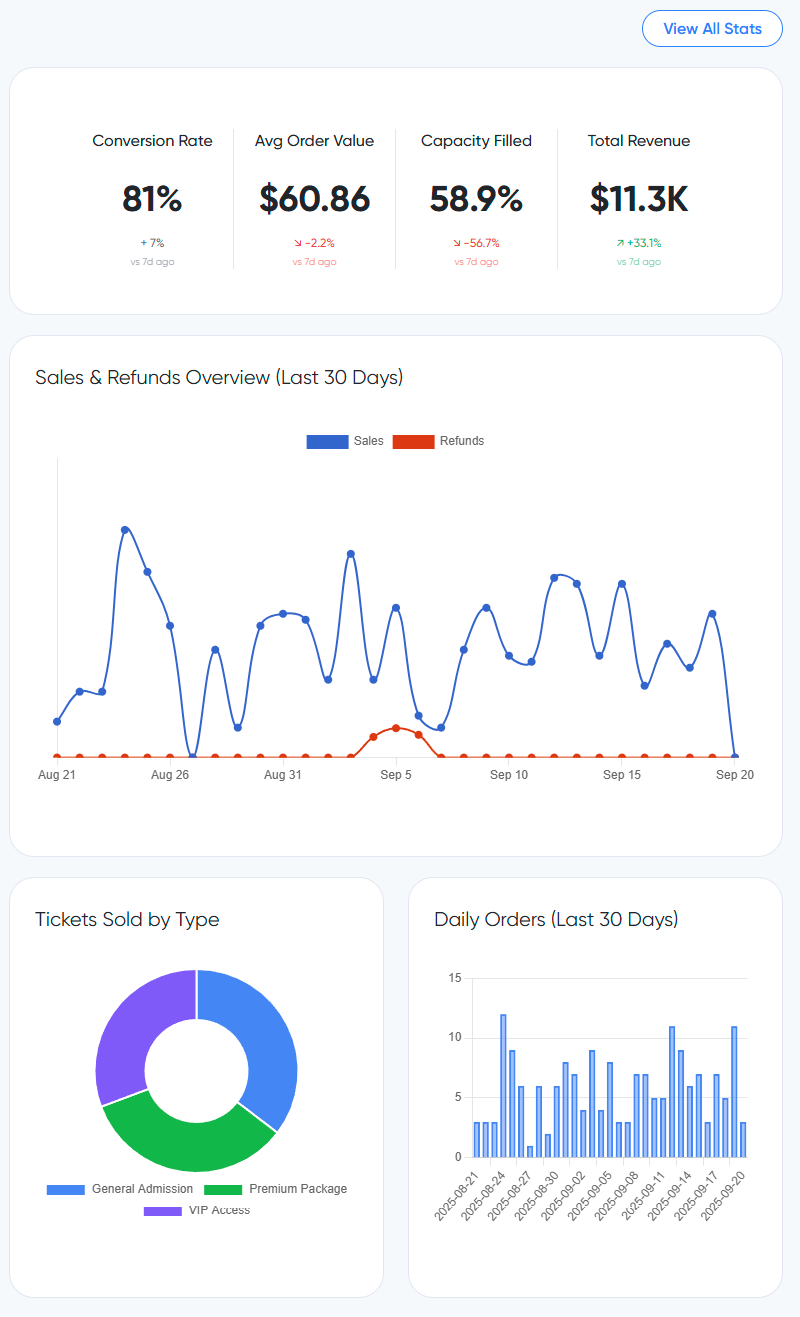
Track ticket sales, revenue trends, and conversion rates with beautiful line charts that show exactly where your money is coming from and when.
Visual trend arrows and percentage changes help you spot patterns quickly. See if sales are up, down, or stable compared to the previous week.
Monitor check-in rates, no-show patterns, and attendance trends to optimize your event planning and capacity management.
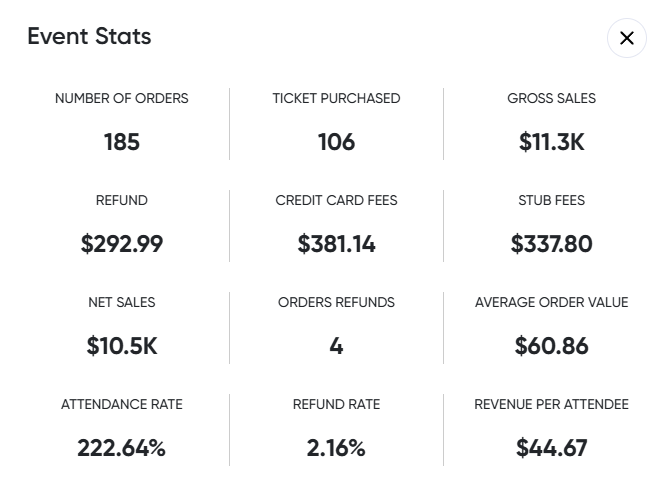
Understand your revenue streams with detailed breakdowns by ticket type, time periods, and customer segments for better pricing strategies.
Track refund patterns and cancellation rates to identify potential issues early and improve customer satisfaction.
Compare current events to past performance with side-by-side metrics that help you understand what works and what doesn't.
Track sales, attendance, and revenue with gorgeous charts and trend indicators that make complex data easy to understand and act upon.

Monitor every aspect of your event performance with detailed statistics, trend analysis, and performance comparisons over time.
